dbt 100 - The foundations
Simplifying dbt concepts for modern data teams

Hey everyone! 👋 Welcome to the first part of my dbt series, where we demystify the data transformation game. I’m Mark, an Analytics Engineer by day, and I remember when I first dipped my toes into dbt. There were so many buzzwords and tools flying around that it felt like trying to learn guitar in the middle of a rock concert.
In this series, my goal is to cut through the noise and break down dbt from the ground up – from core concepts to real-world use. We’ll keep it casual, inject a bit of humor (data can be fun, trust me), and make sure you walk away with actionable insights. Whether you’re totally new to dbt or looking to level-up your analytics engineering chops, this series is for you. Let’s get started with the basics!
1. dbt – The Analytics Engineer’s Best Friend
1.1 Why Choose dbt?
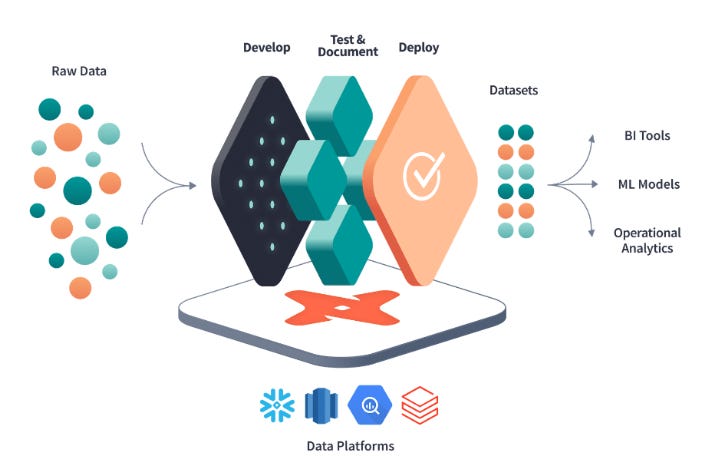
So, what makes dbt so special anyway? Why are modern data teams gravitating towards this tool for the “T” in ELT (Extract, Load, Transform)? Let me break down the big reasons in plain English (with a dash of sarcasm for flavor):
Open Source & Cost-Effective: dbt is free for everyone (at least dbt Core, the CLI version) and open source. In other words, you can harness powerful data transformation without paying for some enterprise ETL behemoth. Perfect for teams of all sizes – from a lone data nerd in a startup to a full-fledged analytics department – no CFO approval needed to get started.
SQL-Based Tooling: If you know SQL (or can copy-paste SQL from StackOverflow 😜), you’re already 90% ready to use dbt. It leverages the SQL skills you and your team have, instead of forcing you to learn a fancy new proprietary language. Sure, you’ll need to get comfortable with a bit of Jinja (think of it as SQL’s cool templating sidekick) and some YAML for configs, but no heavy-duty Python/Java/Go coding is required. It’s basically analytics engineering for the SQL-fluent.
Plays Nice with Modern Cloud Warehouses: dbt was born in the cloud era and plays extremely well with the big data warehouse players – Snowflake, Amazon Redshift, Google BigQuery, Databricks, you name it. It’s optimized for these platforms, meaning you don’t have to wrestle with odd compatibility issues. If your data is sitting in a cloud warehouse (which it probably is these days), dbt speaks its language.
Essential Engineering Features: One thing I absolutely love is that dbt brings software engineering best practices into the data world. Version control integration (so you can
git blamethe colleague who wrote that broken SQL 😅), automated testing (catch those pesky nulls or duplicates before they bite you in a dashboard), documentation generation (auto-generated docs for your models – no more outdated Confluence pages), and even data lineage visualization. dbt automatically builds a dependency graph of your models, so you can literally see how data flows from raw sources to final models. It’s like having a map of your entire transformation pipeline. No more mystery “WTF is this table and where did the data come from” moments.Boosts Team Collaboration: Because dbt is basically code (SQL + config) managed in a repository, it fosters collaboration. Analytics engineers, data analysts, and data engineers can all contribute to the same project in a controlled way. You can peer-review model changes via pull requests, track who changed what, and ensure quality with tests. It’s a unified environment for coding, testing, and deploying transformations, which means less email tag and more actual work getting done. Think of it as Google Docs for your data pipeline, except with way more accountability and far fewer random formatting issues.
dbt projects generate interactive data lineage graphs (DAGs) that show how all your models and sources are connected. In the example above, each node is a model or source table, and the arrows indicate dependencies. This kind of visualization helps you understand the flow of data through transformations and pinpoint upstream or downstream impacts easily.
To sum it up, dbt turns raw data into usable data with maximum efficiency and minimum headache. It’s free, it’s SQL-centric, it’s built for the cloud, and it brings much-needed rigor to data transformation workflows. No wonder it’s the tool du jour for analytics engineers.
2. ETL vs. ELT – Old School vs New School Data Prep
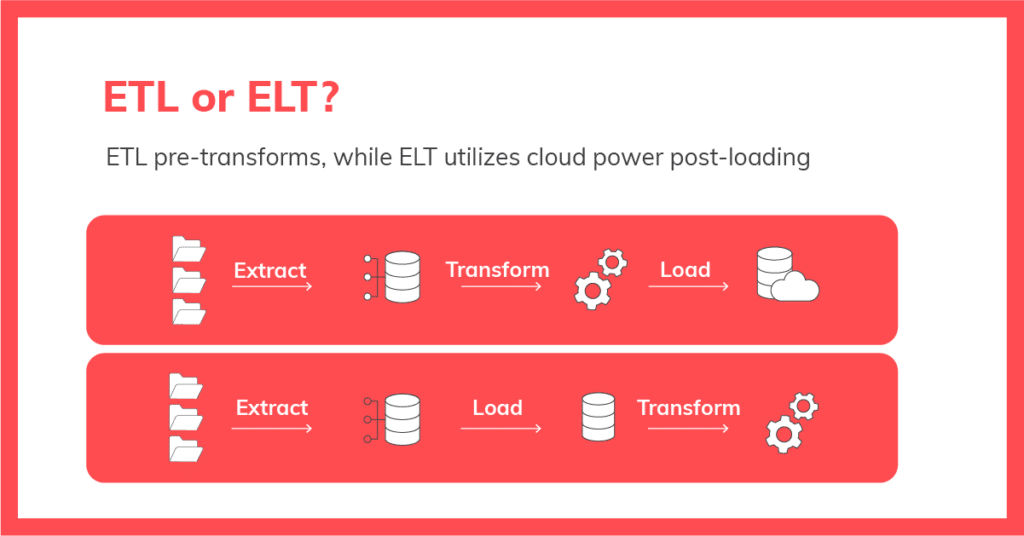
Before we dive further into dbt, let’s zoom out and talk about the bigger picture: ETL vs ELT. These acronyms get thrown around in every data meeting like they’re spells from Harry Potter. But what do they actually mean, and why should you care? Grab a coffee, because understanding this shift is key to seeing why dbt (and tools like it) even exist.
ETL (Extract, Transform, Load) is the traditional way: you extract data from sources, transform it before it gets to your warehouse, and then load the cleaned data into the warehouse. Picture an old-school assembly line where every part is polished and painted off-site before it’s assembled into the final product. The transformations happen on a separate server or an ETL tool before loading. This made sense back when storage and compute were expensive – you didn’t want to dump raw gigabytes into your precious data warehouse if you weren’t using them.
ELT (Extract, Load, Transform) is the modern approach: you extract data from sources and load it raw straight into the warehouse first, and then transform it inside the warehouse. It’s like moving all your raw ingredients into the kitchen first, and then cooking the meal right there. Thanks to the power of cloud data warehouses, we can afford to keep all the raw data around and transform as needed on the fly. The heavy lifting (transformations) happens where the data lives – in BigQuery, Snowflake, Redshift, etc., taking advantage of their massive parallel processing and scalability.
2.1 Why Shift from ETL to ELT?
You might be thinking, “If it ain’t broke, don’t fix it.” But ETL was kind of broke – or at least, not ideal – in today’s world of Big Data and cloud computing. Here’s why the industry flipped the script to ELT (and why you should too):
Cost & Complexity: Back in the day, ETL pipelines required extra servers or apps to handle transformations before loading. That’s more infrastructure to maintain and $$$ to spend. With ELT, you eliminate that middle transformation server – everything happens in one place (the warehouse). Fewer moving parts = lower maintenance and cost. In fact, moving to ELT simplifies the data stack and reduces upfront costs. Why pay for a fancy transformation server when Snowflake or BigQuery can do the job after loading, often more cheaply at scale?
Scalability: When your data volume explodes (and trust me, it will – data has a way of breeding like rabbits 🐇), ETL can struggle. You’d have to beef up that separate transform server or break things into batches. ELT, on the other hand, says “bring it on.” Modern cloud warehouses can scale nearly infinitely and handle transformations in parallel across many nodes. Need to process a billion rows? No problem – ELT will crunch through it by leveraging the warehouse’s muscle, instead of choking your poor ETL machine.
Flexibility & Speed: Here’s a scenario: your analyst comes in and says, “I need a new metric from the raw data, and by the way, can we get it by EOD?” 😅 With ETL, you might groan because the raw data might not even be in the warehouse yet or you’d have to rebuild part of the pipeline to add a new field. With ELT, all the raw data is already there waiting in your warehouse. You can create new transformations on the fly, no need to re-extract or re-pipeline everything. This means faster time-to-insight – analysts and data scientists can start querying data immediately after it’s loaded, even before it’s transformed to perfection. It’s a bit messy, sure, but it gets you answers faster when needed.
Improved Data Governance & Auditability: Perhaps one of the unsung perks of ELT is that you keep an unaltered copy of raw data in your warehouse. Why is that good? Because you always have the source of truth to refer back to. If a transformation goes haywire or someone questions the results, you can always trace back to the raw data and even re-transform it if needed. In ETL, if you transformed something wrong before loading, you might have lost or overwritten the original. With ELT, raw data is preserved, which is a godsend for compliance, audits, and debugging. It’s like having the original unedited photo in Photoshop – you can always revert changes.
Faster Development Cycles: ELT pipelines are usually simpler to build and adjust. Since you’re not tightly coupling extraction with complex pre-load transformations, you can load everything, then iteratively build transformations in SQL. Need a new report? The data’s already there – just write a new SQL model in dbt and generate the table. No need to re-run entire extract jobs. This shortens the development cycle for new analytics substantially.
To put it bluntly, ELT is the new normal for most data teams. Cloud data warehouses made it possible and preferable. As one Fivetran blog put it, ELT is a simpler, faster, and more affordable data pipeline process — and the better option for the vast majority of organizations looking to get more value from their data, faster. Hard to argue with that.
Now, this doesn’t mean ETL is dead (some legacy systems still use it, and there are niche cases where transforming early is useful), but if you’re building a modern analytics stack in 2025 and beyond, you’re probably doing ELT. And guess which tool shines in ELT scenarios? Yup, dbt. It takes that raw loaded data and transforms it inside the warehouse – exactly what the ELT doctor ordered.
3. Traditional Data Team vs. Modern Data Team
Data teams ain’t what they used to be. Back in the “ancient” times (like, say, 2010), data roles were pretty minimal and straightforward: you typically had Data Engineers and Data Analysts, each with fairly distinct responsibilities. Fast forward to today, and you hear about roles like Analytics Engineer, Data Scientist, ML Engineer, etc., as companies realized that one or two people shouldn’t be juggling all data tasks. Let’s focus on the analytics side of things and compare a traditional vs modern data team setup.
3.1 The Traditional Data Team (Two Siloed Roles)
In a traditional data team structure, you basically had two main roles working in a relay:
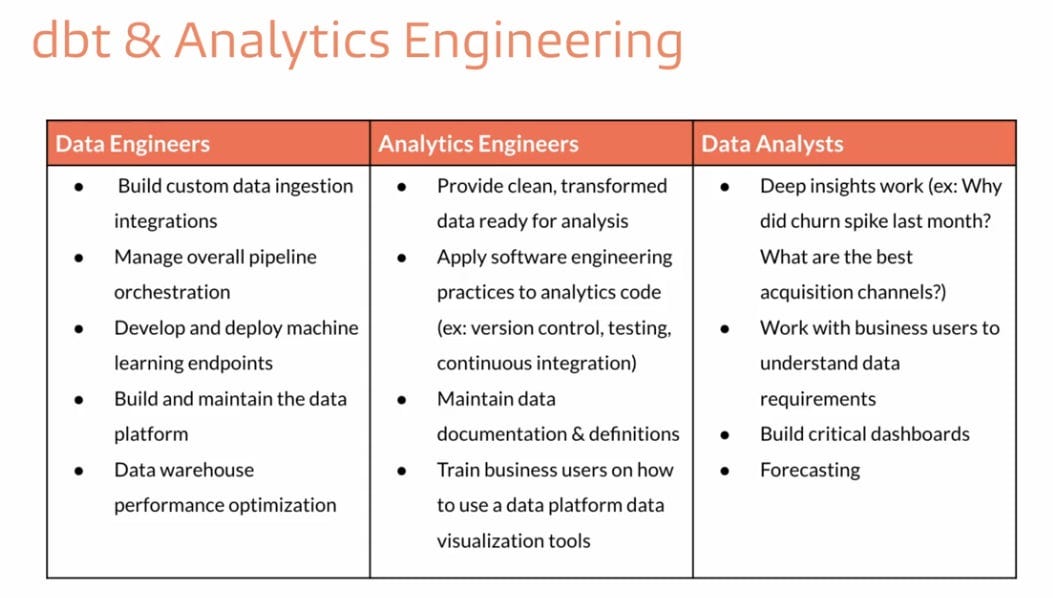
Data Engineer: This was the behind-the-scenes pipeline guru. Data Engineers built and maintained the data infrastructure and ETL processes. They’d write the jobs to fetch data from various sources, massage it (the “T”), and load it into a warehouse or database. Think of them as the plumbers laying down pipes and ensuring data flows smoothly from A to B. Their focus was on reliability, performance, and scaling of the data pipelines (and often a lot of SQL and scripting to get things just right).
Data Analyst: Once the Data Engineers have the data nicely organized in tables and views, the Data Analyst steps in. Analysts are like detectives or storytellers — they query those tables and views to generate insights, reports, and dashboards for business stakeholders. They typically live in tools like Tableau, Excel, or Looker, and their SQL queries are all about answering business questions (e.g., “what was our revenue last quarter and why?”). They usually don’t worry about how the data got there; they trust the Data Engineers for that. They focus on extracting value from the data to support decisions.
In ye olde times, this separation often led to a bit of a wall between the two. The Data Engineer would produce data tables, toss them (metaphorically) over the fence, and say “Analytics, here you go.” The Data Analyst would pick it up and, if something was off or a new data field was needed, would toss a request back, “Hey, can you add this column or fix that thing?” It wasn’t always the most agile process, but it got the job done when data was smaller and less complex.
3.2 The Modern Data Team (Enter the Analytics Engineer)
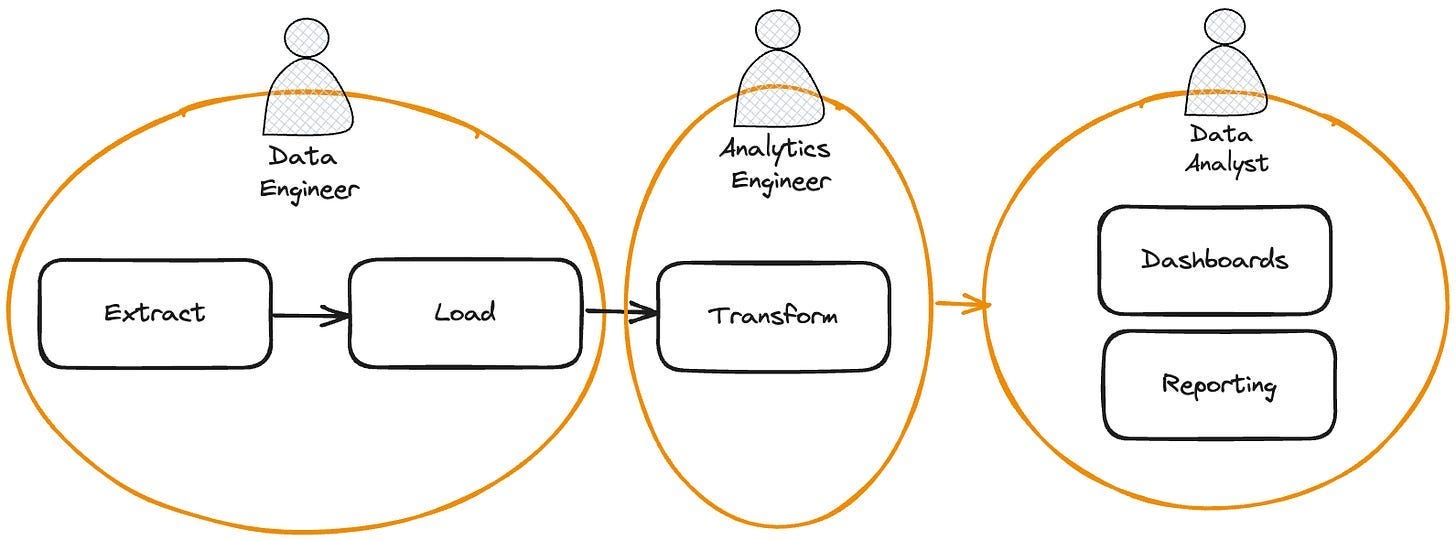
As data systems grew and expectations rose, the industry realized there was a gap between those two roles – and that’s how the Analytics Engineer role was born. In a modern data team, you often have a trio:
Data Engineer: In the ELT world, the Data Engineer’s focus shifts a bit. They are mostly in charge of the “E” and “L” – Extract and Load (plus managing the overall data infrastructure). They set up pipelines to get raw data from source systems (APIs, databases, logs, etc.) into the cloud data warehouse. They worry about things like infrastructure-as-code for ingestion (at my company, we even treat our Fivetran/Airbyte configs as code!), making sure data is flowing reliably. They might manage streaming ingestion or big batch jobs, and ensure the warehouse is partitioned and happy. In short, they get the raw ingredients into the kitchen.
Analytics Engineer: This is the bridge between data engineering and analysis. Once the raw data is in the warehouse, the Analytics Engineer takes over the “T” (Transform) part of ELT. They use tools like dbt (yep, here it is again) to transform that raw mess into clean, business-friendly tables. Their job is to turn piles of raw data into gold – organizing it into models that make sense for analysis, ensuring data quality with tests, adding documentation, and basically curating the data for consumption. If the raw data has 100 columns with cryptic names, the Analytics Engineer might create a model that selects and renames the important ones, does calculations (like revenue = price * quantity), and provides a cleaner structure for analysts to use. They ensure consistency (so that “customer_id” means the same thing everywhere), handle slowly changing dimensions, create aggregate tables, and so on. Think of them as the chef in the kitchen using the raw ingredients delivered by the Data Engineer to cook up something delicious (and digestible) for the Data Analyst. This role is relatively new but super important – it removes a ton of burden from analysts and allows for more scaling and complexity in data without breaking everything.
Data Analyst: The analyst in a modern team can focus on what they do best: generating insights, building dashboards, and answering business questions using the well-prepared data models that the Analytics Engineer has provided. They don’t have to spend 80% of their time cleaning or wrangling data, because much of that is handled upstream. Analysts today often still write SQL or use BI tools, but they operate on a more solid foundation. In some cases, they might also be proficient in Python or R for advanced analysis, but they’re empowered by having consistent, clean data (courtesy of the analytics engineering work) and can trust that someone has their back on data quality.
It’s worth noting that in a small company or startup, one person might wear all these hats in the same day – extracting data in the morning, building dbt models after lunch, and doing analysis by evening. Titles aside, the functions still need to happen. But as teams grow, these roles specialize and collaborate. The lines can still be blurry (a data engineer might write dbt models, an analyst might tweak a pipeline), but this framework helps distribute the work more manageably.
(Side note: There’s also the Data Scientist and ML Engineer roles in many modern data teams, focusing on predictive models and machine learning, but that’s outside our scope for now.)
The rise of the Analytics Engineer role is closely tied to tools like dbt – it became feasible to have a dedicated person (or team) own the transformation layer, using software-engineering-like processes. This evolution was succinctly described by some in the industry: the Analytics Engineer is the one who “ensures that the data analysts don’t have to do data engineering in a spreadsheet” – they package up the data nicely so analysts can just consume it.
The bottom line: modern data teams are more specialized and collaborative. By introducing an analytics engineering function, companies bridge the gap between raw data and insights. It means cleaner data, clearer ownership, and ultimately faster and more reliable analytics.
4. Cloud-Based Data Warehouses – Data’s Cloudy Home

Let’s talk about where all this data is living nowadays. Enter the Cloud-Based Data Warehouse (DWH) – basically the heart of the modern analytics stack. If you’re imagining a giant magic box in the sky that holds all your data and lets you query it super fast, you’re not far off. Cloud data warehouses combine the old-school concept of a data warehouse with the scalability and flexibility of cloud computing.
In plain terms, a data warehouse is just a specialized database optimized for analysis (reading lots of data) rather than handling transactions (like your typical production DB that handles app logins or sales). Now, make it cloud-based: you don’t have to manage the hardware or install software. Instead, companies like Amazon, Google, Snowflake, etc., manage it for you and give you a nice interface (usually SQL) to interact with your data.
Key things that make cloud data warehouses awesome:
Scalability & Elasticity: Need more compute power to crunch a massive query? Scale up a cluster in seconds. Done processing? Scale down to not burn money. Traditional on-prem warehouses would have you provision big servers (which took time and money to upgrade). Cloud warehouses let you dynamically adjust resources on the fly. Some are even serverless (e.g., BigQuery) where you don’t even see the notion of a server or cluster – you just run your SQL and Google magically figures out how many machines to use behind the scenes. The result: near-infinite scalability and the ability to handle big data without a headache.
Separation of Storage and Compute: This is a game-changer architecture that Snowflake popularized. It means you can scale your storage (how much data you keep) separately from your compute (how many CPU/ram you’re burning for queries). In Snowflake’s case, they have a storage layer (all your data sitting in S3, basically) and many independent compute clusters you can spin up (they call them “virtual warehouses”) that all access the same storage. This gives concurrency and flexibility – multiple teams can query the same data with different clusters without impacting each other. And you pay for compute only when you use it. Redshift, in contrast, originally had coupled storage/compute (fixed nodes that do both), which made scaling trickier (though Redshift has improved with RA3 nodes and such). BigQuery took it further: storage is decoupled and compute is on-demand per query. In short, cloud DWHs let you treat storage and processing independently, which is efficient and convenient.
Performance for Analytics: Cloud warehouses use columnar storage and MPP (massively parallel processing) under the hood. Columnar means data is stored column-by-column rather than row-by-row, which is insanely faster for analytical queries that might only need a few columns of a huge table. MPP means a query gets split into pieces and runs on many nodes in parallel, then gets combined. That’s why you can query a trillion records in seconds (if you’re willing to pay for the compute!). The likes of Snowflake, BigQuery, Databricks SQL, etc., are built to crunch large datasets quickly using these techniques.
In-warehouse Transformations (Enabling ELT): As we discussed, one of the biggest shifts with cloud DWHs is that you can do transformations inside the warehouse efficiently. This removes the old need to transform data on a separate ETL server. You load raw data in, and then use the warehouse’s power (with SQL or even Python in-DB) to do the cleaning, joining, aggregating, etc. It cuts down data movement – no more shipping data out to transform and then back in. This streamlines the pipeline (less “hopscotch” for your data) and is one of the reasons ELT is even feasible. Modern warehouses are so powerful you can just throw raw data at them and transform as needed, rather than pre-processing everything to fit in.
Reduced Maintenance & Ops: Because it’s cloud, you don’t worry about patching the OS, upgrading the database software, or replacing failed disks. The providers handle that. Need a new environment or to restore data? Often it’s a few clicks or commands. This means your data engineers can focus on data problems, not hardware problems. Also, features like automated backups, encryption, and high availability are usually built-in by default.
To make it less dry, let me give an example: Snowflake (one of the most popular cloud DWHs). Snowflake has a three-layer architecture – storage, compute, services.
Storage is your data (they compress it nicely and store in cloud storage).
Compute are those warehouses (clusters) you spin up to run queries.
Services is the brain that coordinates things (authentication, metadata, query optimization).
You can have a “small” warehouse for ad-hoc stuff and a “large” warehouse for heavy transformations, all querying the same data. If one warehouse is running a huge job, it doesn’t slow down the others – they’re separate. This was revolutionary compared to older systems where one big slow query could starve others on the same cluster. Snowflake’s design also lets you have zero-copy clones of data (for testing, etc.) and time-travel (query data “as of” some time in the past). Pretty neat stuff.
BigQuery takes a slightly different approach: it’s serverless. You don’t even manage warehouses or clusters. You just run SQL, and Google automatically allocates the necessary resources. It’s like magic – you get a result or your query times out if you ask for something crazy. BigQuery also separates storage/compute and even charges them separately (storage by data volume per month, compute by bytes processed per query).
Other notable ones: Amazon Redshift (one of the first cloud data warehouses) had a more traditional cluster approach (you choose node types, etc.), but it’s improved with elasticity in newer versions. Databricks with their SQL Warehouse (formerly SQL Analytics) is bridging data warehouses and data lakes (Lakehouse concept) – but that’s another story.
We also have DuckDB on the scene (which I personally love for local analytics or small scale). DuckDB is not distributed – it’s an in-process analytical database (like SQLite for analytics). It’s columnar and super fast on one machine. There’s even MotherDuck, which is a cloud service using DuckDB under the hood for a “serverless DuckDB” experience, scaling it via some shared-nothing federation (sort of a middle ground between local and cloud). DuckDB is awesome for quick prototyping or embedded analytics in a Python script.
The cloud DWH basically paved the way for the modern data stack. It’s the central hub where raw data lands and transformed data lives. It’s what made ELT pipelines realistic (store everything first, transform later). And it’s continuously evolving – with some warehouses now adding built-in machine learning, semi-structured data support (JSON storage and querying), and more.
In our context, just remember: dbt loves cloud data warehouses. It’s where it performs all those model transformations. So understanding that your warehouse (be it Snowflake, BigQuery, etc.) is a powerful engine and not just a dumb storage – that’s key. We leverage that power heavily in the transformation step.
5. The Modern Data Stack (and Where dbt Fits In)
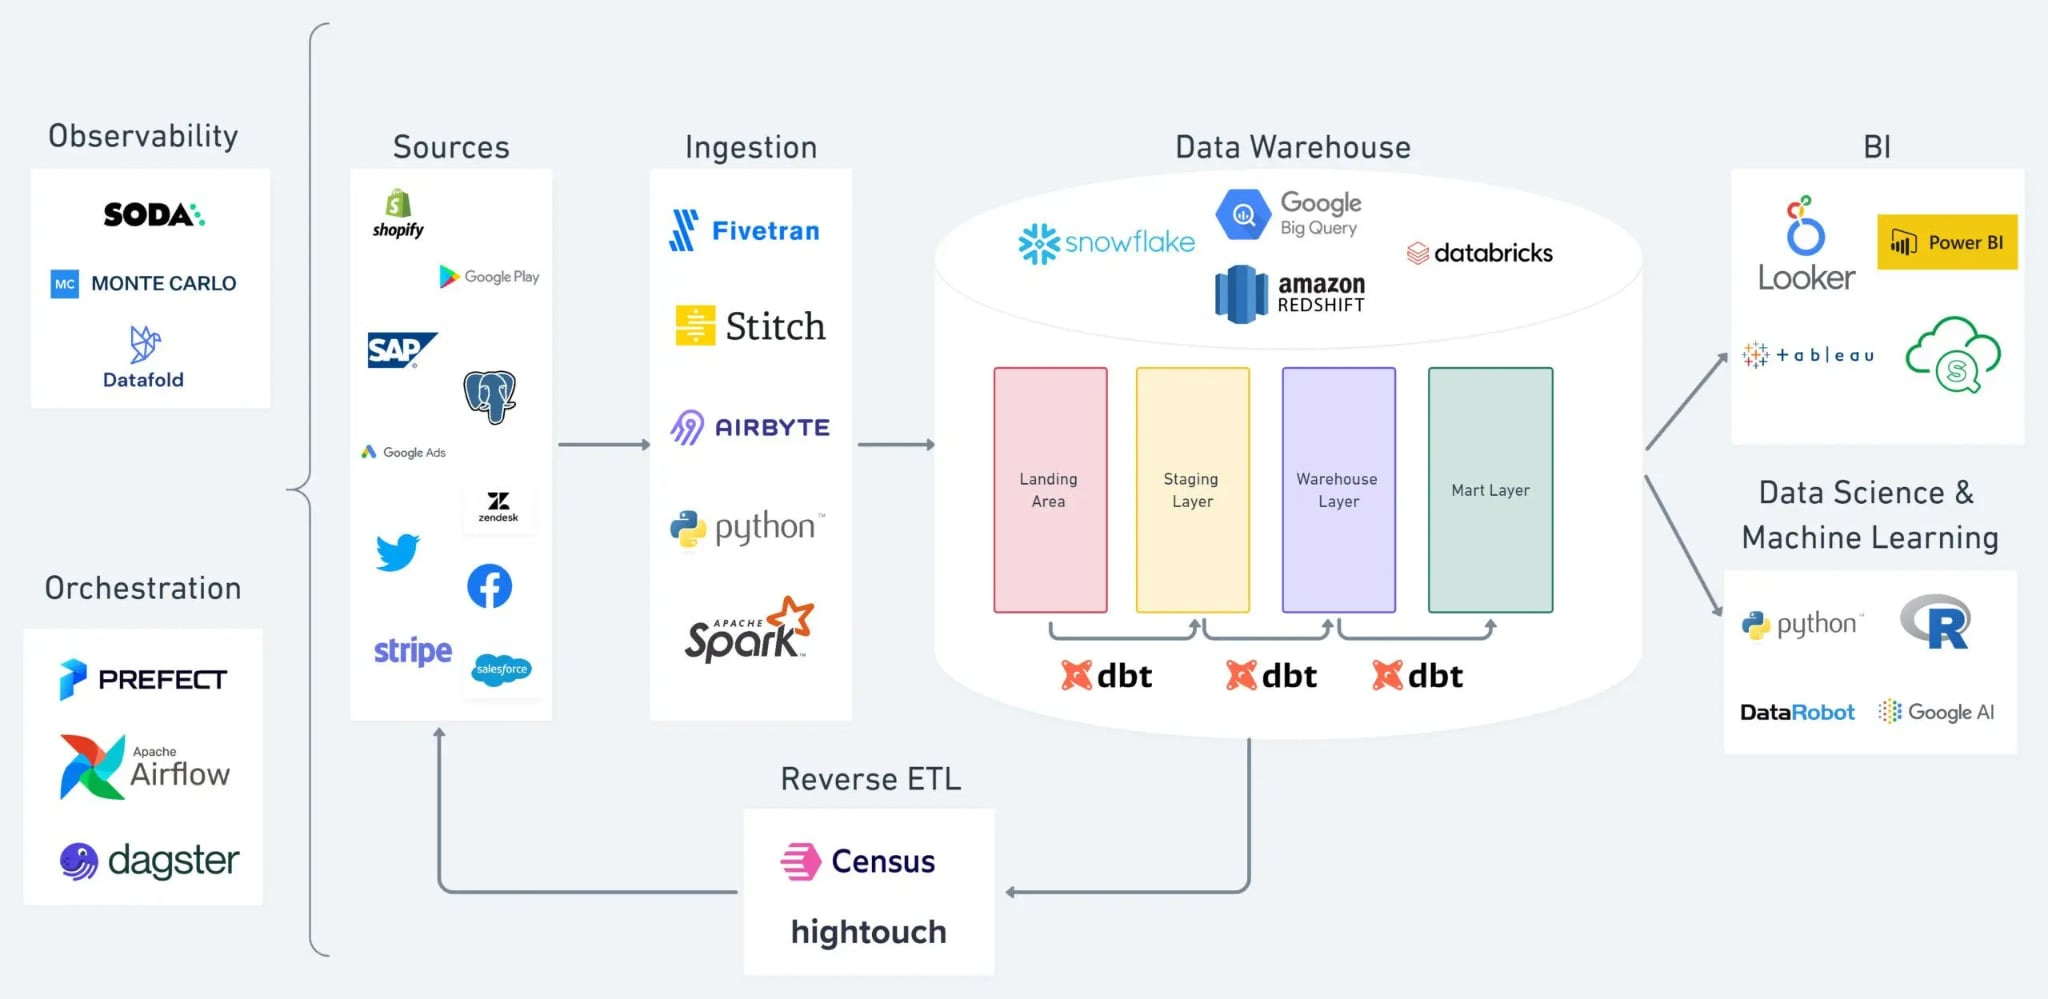
By now, you’ve heard me mention a bunch of tools and terms. Let’s put it all together. The modern data stack is a fancy way of saying “here’s the collection of tools that an analytics-focused company uses to get value out of data.” It typically looks like a pipeline or layers, something like this:
A high-level diagram of a modern data stack pipeline. Data flows from source systems (left) through an ingestion layer into a cloud data warehouse (center), where it’s transformed (with tools like dbt) into refined tables. The refined data is then used by BI tools for dashboards and by data science/ML tools for modeling, and can even be fed back to business tools via reverse ETL. Each part of the pipeline has popular tool options (e.g., Fivetran for ingestion, Snowflake for warehouse, dbt for transform, Tableau for BI, etc.).
Let’s break down the components of this stack in a relatable way:
Source Data: This is where it all begins – the raw input. It could be data from your app’s production database, a CRM like Salesforce, marketing platforms like HubSpot, etc. Basically, any system where data is generated in the course of business.
In the modern stack, we often have dozens of sources. For example, your sales team might use Salesforce (so you want that data), marketing uses Facebook Ads and Google Analytics (you want those), product logs are in some Postgres or maybe streaming in via Kafka, etc. The challenge: these sources are all over the place and in different formats (APIs, databases, files...).
Ingestion (Extract & Load) Tools: Instead of writing a million scripts to collect data from each source, we have tools to automate this. Services like Fivetran, Airbyte, Stitch and others are popular. They provide connectors to common sources, so you can say “hey, grab all my Salesforce data and load it into my warehouse, keep it updated.”
For example, at my day job we use Airbyte (managed via Terraform, because we treat even our ingestion as code — yeah it’s pretty cool and very DevOps-y). These tools essentially do the copy-paste of data from source to destination on a schedule. You configure a Source (what to grab, e.g., Salesforce objects), a Destination (where to put it in your warehouse), and a Connection/Schedule (how often to do it, and do you want full loads or incremental).
In a side project, I might not want to run a whole Airbyte server, so I could use something lightweight like dlt (data loading library) in Python to pull from an API to my local DuckDB. The goal is the same: get the raw data into the warehouse with as little manual effort as possible.
Cloud Data Warehouse: We covered this in the last section. This is your central data hub (Snowflake, BigQuery, Redshift, Databricks, etc.). All raw data lands here, usually in a schema or tables that mirror the sources (like a schema called
raw_salesforcewith dozens of tables that Fivetran synced). The warehouse at this stage contains a lot of raw chaotic data. But that’s okay; step 3 is all about taming it.Transformation (dbt): Here comes our star, dbt. Once data is in the warehouse, you typically don’t want end-users or analysts directly querying the raw tables (they might be unwieldy, or have cryptic names like
tbl_OG_0zx13fwith IDs instead of meaningful data). So you build models in dbt to clean and organize this data. dbt will select from those raw tables, do joins, filtering, maybe add business logic (“flag customers as VIP if they spend $X”), and output new derived tables in the warehouse. These could be organized in layers (staging -> intermediate -> marts, in dbt lingo). The coolest part: dbt also handles testing (you can assert things like “email is not null in the customers table” or “each order_id is unique”) and documentation (auto-generating docs for each model and how they relate). And with the DAG (Directed Acyclic Graph), dbt shows you visually how everything is connected. That lineage graph helps you see, for example, that themonthly_salesmodel is downstream oforderswhich comes fromraw.orders_csvsource, etc. It’s hugely helpful for impact analysis (change something in one model, see what will be affected downstream). In short, dbt is the transformation workhorse that turns raw data into the shiny, analysis-ready datasets.Business Intelligence (BI) Tools: Now that we have nice tables and views in the warehouse (thanks to dbt), it’s time to actually use the data. BI tools are where your non-data-expert stakeholders usually interact with data. Think Tableau, Power BI, Looker, Mode, Metabase, or even custom apps. These tools connect to the warehouse and allow you to create charts, dashboards, and reports.
A good BI tool lets you slice and dice the data, drill down, and share insights with the team. My personal faves are Mode and Hex these days (I find them more flexible, especially if you love SQL or want to mix SQL with Python notebooks). But whether you use a slick GUI tool or something like a Jupyter notebook to present findings, this layer is all about visualization and analysis.
One emerging trend here is “BI as code” – tools like LookML (Looker’s modeling layer), or newer ones like Lightdash or Transform, where you define metrics and dashboards in YAML or code, checked into Git. This way, even your dashboards and KPIs are version-controlled and reproducible. (I could rant about how many times I’ve seen two reports show different numbers for “the same metric” because of inconsistent definitions – BI as code aims to solve that by centralizing definitions.)
Data Science / ML: Some stacks include this as another layer. You have your cleaned data, now you can feed it into machine learning models. Data scientists might pull transformed data from the warehouse into Python notebooks, train models (for churn prediction, recommendation systems, etc.), and sometimes deploy those models. Tools like DataRobot or even just custom code manage this. This isn’t directly related to dbt, but it’s often parallel – data scientists love when an analytics engineer has already created a clean feature table they can use for modeling, rather than them doing heavy lifting in Pandas every time.
Reverse ETL / Operational Analytics: This is the newer kid on the block. It refers to taking the insights or modeled data from the warehouse and pushing it back into operational tools. For instance, you create a high-value customer list in the warehouse and want to send that to Salesforce as a leads list for sales teams, or update a marketing email list in HubSpot based on analytics data. Tools like Hightouch or Census do this “reverse ETL” automatically. It essentially closes the loop, making warehouse data actionable in day-to-day apps. If BI is for humans to see the data, reverse ETL is for systems to react to the data.
So where does dbt fit? It’s smack dab in the middle, in the Transformation segment of this stack. It relies on the warehouse (data must be loaded there first via EL tools), and it feeds the BI/analytics layer with good data.
One more point on orchestration (making all the above run like a scheduled symphony): Tools like Airflow, Prefect, Dagster might oversee the scheduling: e.g., at 1AM run the Fivetran sync, at 2AM run the dbt models, at 3AM refresh the dashboard or retrain the ML model, etc. In my projects, I’ve used Prefect for simple orchestration – it’s Pythonic and easy to kick off flows. At work, we use Airflow to schedule everything (the Airflow DAG might say: run these 10 Airbyte connectors, then run dbt, then notify Slack if things fail).
To wrap this section up: The modern data stack is like a set of Lego blocks – you pick one from each category that fits your needs, and they all click together (usually). dbt is the block that has become nearly ubiquitous for the Transform piece because it meshes so well with the cloud warehouse paradigm and brings engineering rigor to analytics. And as data teams, when we have a solid stack, it means our pipelines don’t need babysitting – they just run (well, most of the time 😅).
Outro
Thanks for sticking with me through this first part of the dbt 101 journey! 🎉 We covered a lot of foundational ground – from what dbt is and why it rocks, to the shift from archaic ETL to shiny ELT, the changing roles in data teams, and how cloud data warehouses and modern tools set the stage for everything. If it feels like a firehose of information, don’t worry – we’ll dig into the practical stuff in the upcoming posts.
In Part 2 and beyond, we’ll get our hands dirty: setting up your first dbt project, writing models, configuring tests and documentation, and deploying changes with confidence. I’ll share tips and gotchas from my own experience (i.e., mistakes) as an analytics engineer, so you can learn from them. By the end of this series, my goal is not just that you understand dbt, but that you start thinking like an analytics engineer – designing data models that are scalable, reliable, and easy to collaborate on.
If you enjoyed this read or learned something new, consider subscribing to get notified when the next part drops. 😊 Got questions or something wasn’t clear? Feel free to reach out or comment – I’d love to help. And if you have that one friend who’s still doing all their data transforms in a single monstrous SQL script, do them a favor and share this post.
Data engineering and analytics are converging, and tools like dbt are a big reason why. So let’s continue to bridge that gap – one model at a time. 🚀
— Minh (Mark) Pham